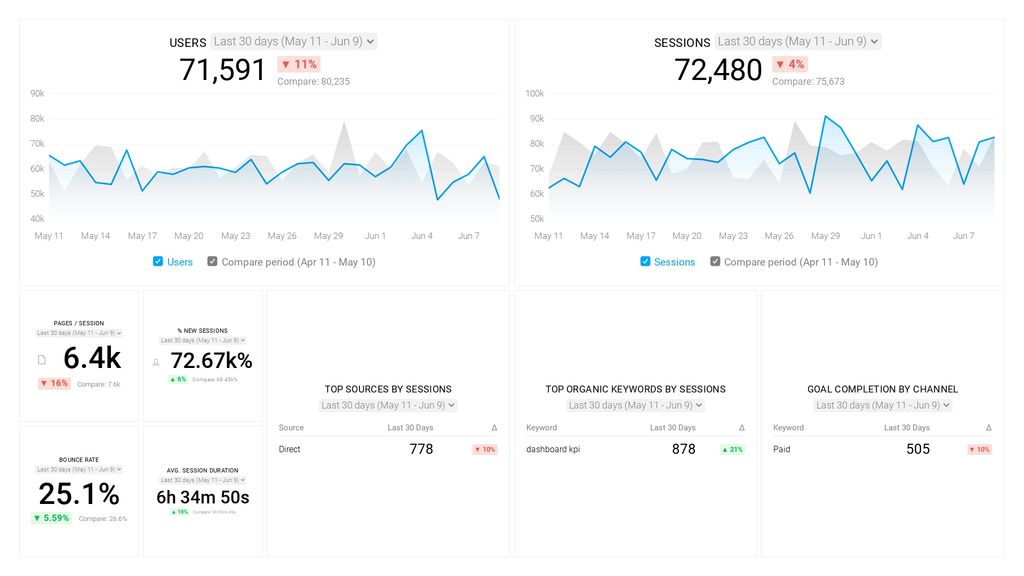
The Databox analytics platform provides real-time access to all kinds of tracking data, giving businesses the ability to monitor performance in a variety of areas.
The cloud-based Databox software also presents the data in easy-to-understand charts and graphs, giving the user helpful context.
Although quite a few of the best data visualization tools can help businesses interpret their data, Databox sets itself apart by focusing on usability.
Rather than needing quite a bit of technical know-how to figure out how to read the data, Databox simplifies the process without the need for significant customization.
Databox allows users to customize the dashboards to show them the most important information, but it doesn’t require this step like more complex software does.
Databox Pros and Cons
Pros
Clear interfaceSimplifies comprehending complex data setsAllows basic customization of dashboardsIntegrates easily with SlackCan send reports to anyoneAllows users to set goalsQuickly pulls in data to useCan update data in real-timeAllows brandingEasy to use
Cons
Some integrations are tricky to set upLacks extensive customization featuresDifficult to select custom ranges for data analysisLimits on the number of simultaneous dashboardsUpper tiers become expensive quickly
How Databox Compares to Top Data Visualizat… Read More